If you have ever stared at a blank white screen after activating a plugin, or watched a form silently fail to save data, you already know why you need to debug PHP errors in WordPress properly instead of guessing. WordPress ships with a full debugging toolkit built in — WP_DEBUG, error logs, and the Query Monitor plugin — but most developers only turn on half of it, or leave debug output visible on a live site by mistake. This guide walks through setting up debugging the right way, reading what WordPress is actually telling you, and the mistakes that cause the most damage.
Turning On WP_DEBUG the Right Way
WP_DEBUG is the master switch for WordPress’s built-in debugging system. It lives in wp-config.php, above the line that says /* That's all, stop editing! */.
define( 'WP_DEBUG', true );
define( 'WP_DEBUG_LOG', true );
define( 'WP_DEBUG_DISPLAY', false );
@ini_set( 'display_errors', 0 );
Each constant does a different job:
WP_DEBUG— enables PHP error, warning, and notice reporting throughout WordPress core, themes, and plugins.WP_DEBUG_LOG— writes every error towp-content/debug.loginstead of (or in addition to) the screen.WP_DEBUG_DISPLAY— controls whether errors print directly on the page. Set this tofalseon any site real users can see.
Warning: Never leave WP_DEBUG_DISPLAY set to true on a production site. Raw PHP errors printed on the page can expose file paths, database table names, and plugin versions — information that makes an attacker’s job easier. Log to a file instead.
Reading the Debug Log
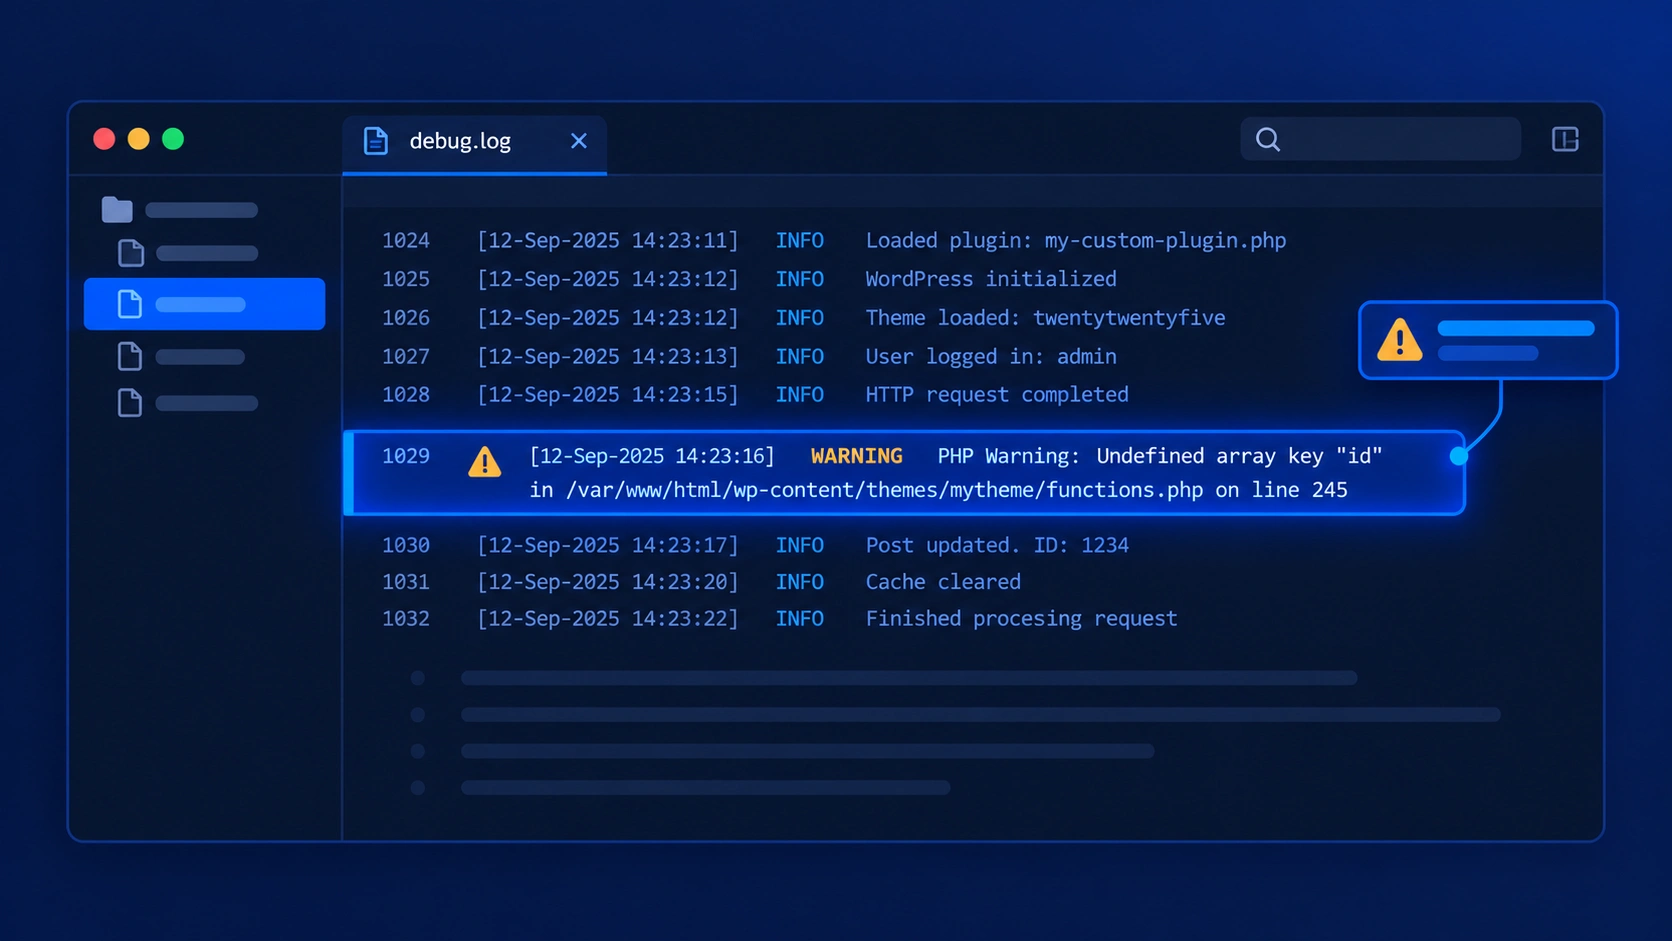
Once WP_DEBUG_LOG is on, every notice, warning, and fatal error gets appended to wp-content/debug.log. You can tail it from the command line while reproducing a bug:
tail -f wp-content/debug.log
A typical entry looks like this:
[15-Sep-2026 10:22:41 UTC] PHP Warning: Undefined array key "email" in /wp-content/plugins/my-plugin/includes/class-form-handler.php on line 42
That line number is exact — go straight to it. If the log is empty after you’ve reproduced the bug, check that the wp-content directory is writable, since WordPress silently fails to create debug.log when it isn’t.
Note: debug.log grows forever unless you clear it. On a busy site it can reach hundreds of megabytes within weeks. Rotate or delete it periodically, and never commit it to version control.
Custom Logging With error_log()
For debugging your own code, PHP’s error_log() writes straight to the same debug log when WP_DEBUG_LOG is enabled:
function wpwebguru_debug_cart_total( $total ) {
    error_log( 'Cart total before tax: ' . print_r( $total, true ) );
    return $total;
}
add_filter( 'woocommerce_cart_total', 'wpwebguru_debug_cart_total' );
For arrays and objects, wrap the variable in print_r( $var, true ) or wp_json_encode( $var ) so it’s readable instead of dumping Array with no detail.
Using Query Monitor
Query Monitor is a free plugin that turns debugging from log-reading into a live admin bar panel. Install it, and it shows, for the page you’re currently viewing:
- Every database query run, how long each took, and which function called it
- PHP errors, warnings, and deprecated-function notices, with the exact file and line
- Hooks fired and which callbacks ran on them
- HTTP API requests made during the page load, with response times
- Template files loaded, in order
The Queries panel is especially useful paired with the site’s existing SQL query optimization techniques — Query Monitor will flag duplicate queries and anything run inside a loop, which is usually the first sign of a missing cache or a misplaced database call.
Note: Query Monitor is a development tool. Deactivate it on production, or restrict its output to admins only (it does this by default), since it exposes internal query and hook detail you don’t want visible to the public.
Common Fatal Errors and What They Mean
A few errors show up constantly and are worth recognizing on sight:
- “Allowed memory size of X bytes exhausted” — a script used more memory than PHP’s
memory_limitallows. Raise it inwp-config.phpwithdefine( 'WP_MEMORY_LIMIT', '256M' );, but treat this as a symptom — look for an infinite loop or an unbounded query first. - “Call to undefined function” — usually means a plugin or theme function is being called before the plugin that defines it has loaded, or the plugin is deactivated.
- “Maximum function nesting level reached” — an infinite recursion, often from a function that calls itself, or two hooked functions that trigger each other.
- White Screen of Death (WSOD) — a fatal error with
WP_DEBUG_DISPLAYoff and no visible message. Checkdebug.logfirst; if it’s empty, check the web server’s own PHP error log, since some fatal errors happen before WordPress’s error handler loads.
Common Mistakes to Avoid
- Leaving
WP_DEBUG_DISPLAYtrue in production. This is the single most common WordPress debugging mistake and a real information-disclosure risk. - Debugging live instead of on staging. Reproducing a bug with debug output on for real visitors risks exposing errors to them mid-diagnosis.
- Ignoring deprecated-function notices. They’re silent today but often mean a function will be removed in a future WordPress release — exactly the kind of change covered in WordPress 7.0’s breaking changes.
- Not checking the server’s PHP error log. Some fatal errors (parse errors, memory exhaustion before WordPress loads) never make it into
debug.logat all. - Suppressing errors with
@instead of fixing them. The@operator hides the symptom; the underlying bug, and the security risk it can carry, stays in the code. - Forgetting to check REST API debug output separately. AJAX and REST endpoints can fail silently in the browser console even when
debug.loglooks clean — worth keeping in mind if you’re building a custom REST API endpoint.
Wrapping Up
Debugging PHP errors in WordPress comes down to three habits: turn on logging (not on-screen display) everywhere except a local environment, actually read what debug.log and Query Monitor are telling you instead of guessing, and treat deprecated notices as early warnings rather than noise. Once this workflow is second nature, most bugs take minutes to locate instead of hours.
For related hardening once your code is stable, see the site’s WordPress security checklist, the SQL query optimization guide, and the guide to building a custom REST API endpoint.